Introducing LSM-MS2
We're excited to introduce LSM-MS2-enabled-ID in Pyxis, our first major capability release for MS/MS spectra. The model represents a significant advancement in how researchers identify and interpret metabolites from raw mass spectrometry data.
Upload your data, get comprehensive identifications with scores, then analyze with Pyxis' statistical and visualization tools. Available today.
Confident ID at Scale
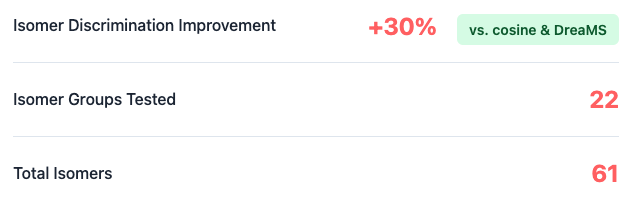
LSM-MS2 processes hundreds of thousands of MS2 spectra and returns putative identifications with transparent scores. The model excels at distinguishing isomeric analytes, compounds with identical masses but different structural arrangements, which have historically challenged automated identification systems. On our curated benchmark of 61 biologically relevant isomers across 22 isomer groups, LSM-MS2 correctly identifies nearly 30% more compounds than previous methods.
Every identification includes a score ranging from 0-100, allowing researchers to filter results based on their quality requirements. Researchers can establish score thresholds appropriate for their study requirements—whether prioritizing recall for discovery or precision for targeted validation.
Typical untargeted analyte studies with 50-100 samples complete in approximately 20 minutes, enabling rapid iteration between data collection and interpretation.
Transparent and Verifiable Results
Every identification in Pyxis links back to verifiable spectral evidence. Click any metabolite to inspect the mirror plot comparing your experimental spectrum against the reference, with matching fragment ions highlighted.
You can also export just about any data you see in Pyxis: metabolite identifications with scores, statistical analysis results, and publication-ready figures. All exports use standard formats compatible with downstream analysis tools.
Accessible Through Standard Workflows
Pyxis has been validated across major MS platforms including Thermo Fisher, Waters, Agilent, and SCIEX systems. The platform adapts to different collision energies, fragmentation methods, and mass accuracy specifications without requiring instrument-specific tuning.
Standard mass spectrometry file formats are supported, including RAW files and open formats like mzML and mzXML.
Comprehensive ID Coverage
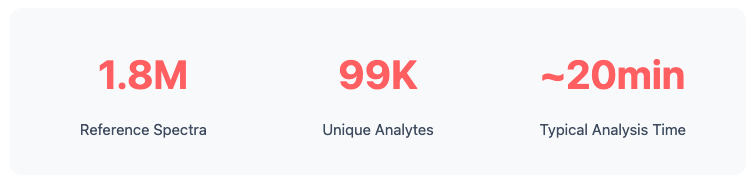
LSM-MS2 achieves high identification rates across diverse compound classes and sample types. Our reference library comprises 1.8 million high-quality spectra corresponding to 99K unique analytes.
All entries were curated, quality-controlled, and merged across multiple public and internal sources (NIST, MassBank, MSnLib, MoNA, GNPS, and internally acquired datasets).
Performance Benchmarks
We evaluate spectral identification across three complementary datasets:
MassSpecGym
The most comprehensive public benchmark for tandem MS/MS data
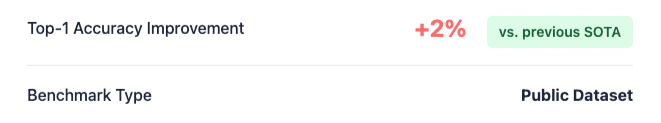
LSM-MS2 achieves a Top-1 per-spectrum Accuracy of 0.739—corresponding to 94% of the maximum achievable accuracy given reference library coverage and representing a 2% improvement over prior methods—establishing it as the new state of the art.
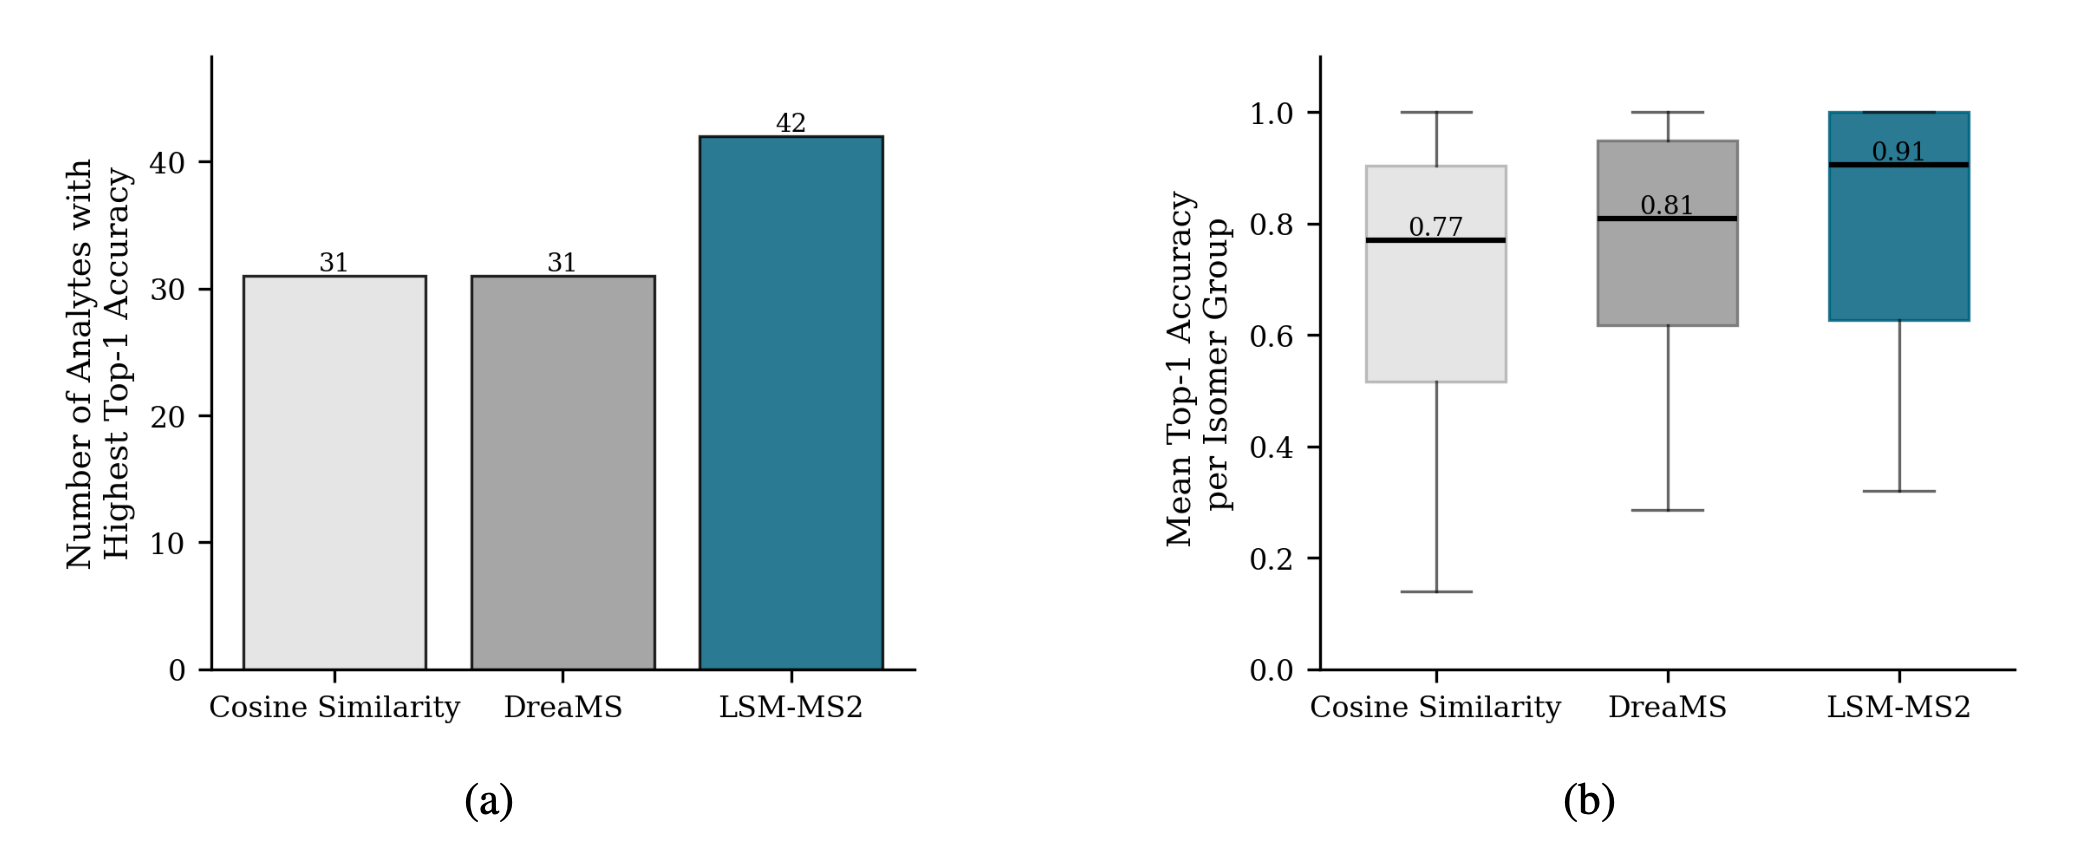
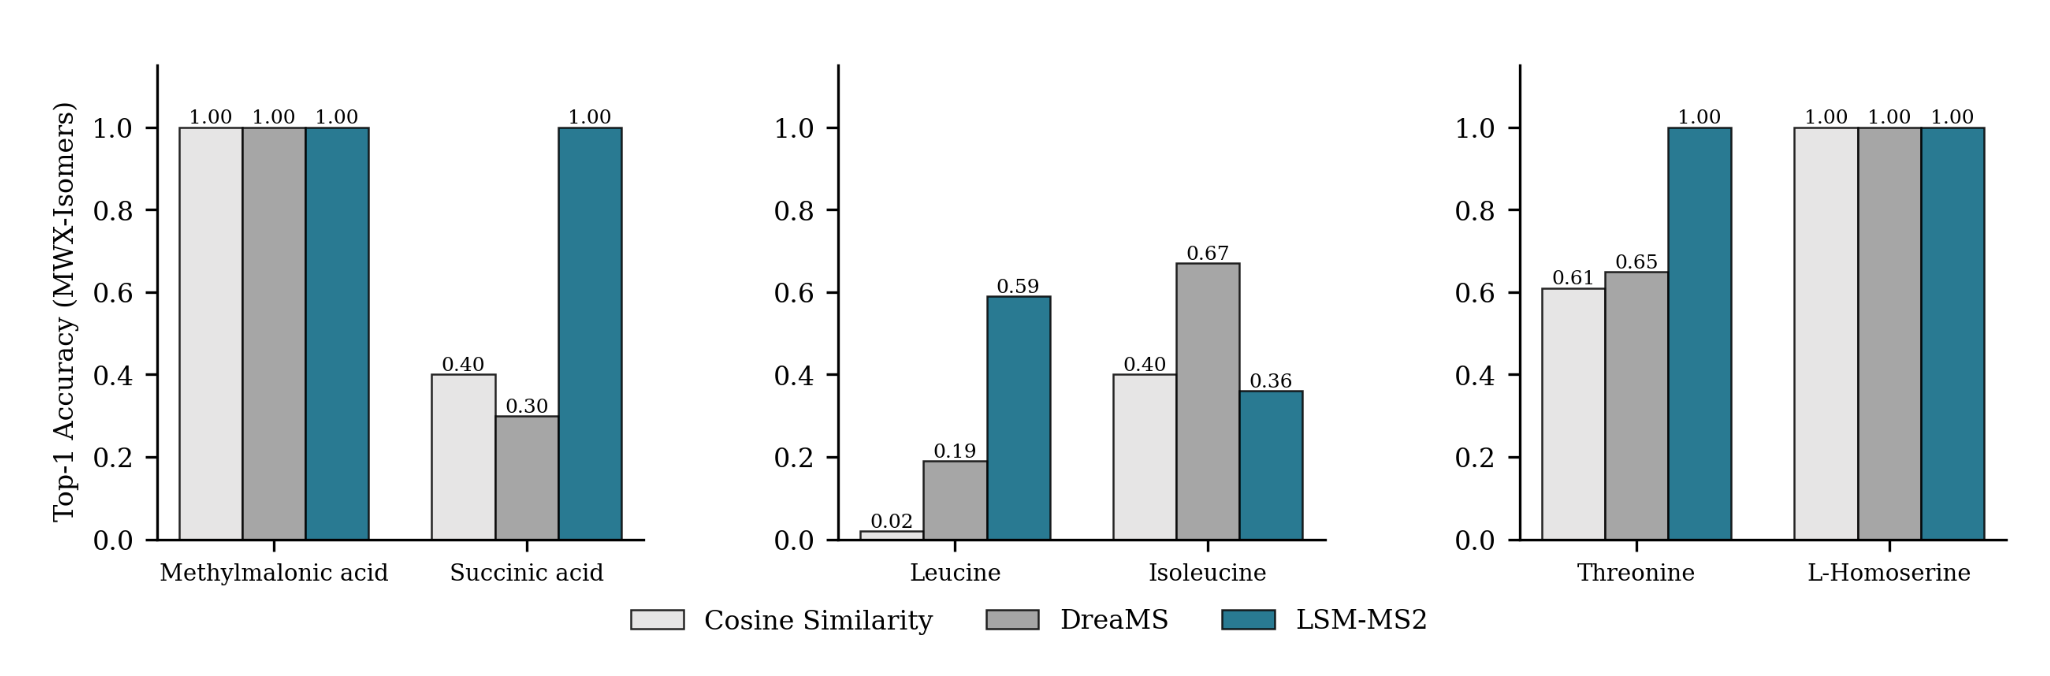
MWX-Isomers (Internal Benchmark)
A targeted dataset of 61 biologically relevant isomers across 22 isomer groups, collected to assess isomeric discrimination for analytes underrepresented in MassSpecGym
Achieving high accuracy on a single analyte is meaningless if its corresponding isomer receives a low score.
Despite using no explicit isomer-focused contrastive supervision during training, LSM-MS2 predicts nearly 30% more analytes with higher top-1 accuracy than both cosine similarity and DreaMS.
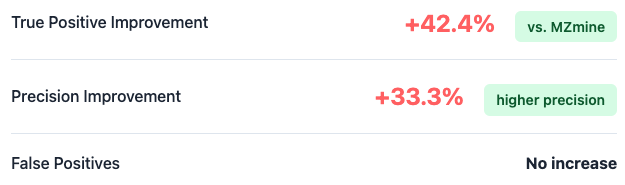
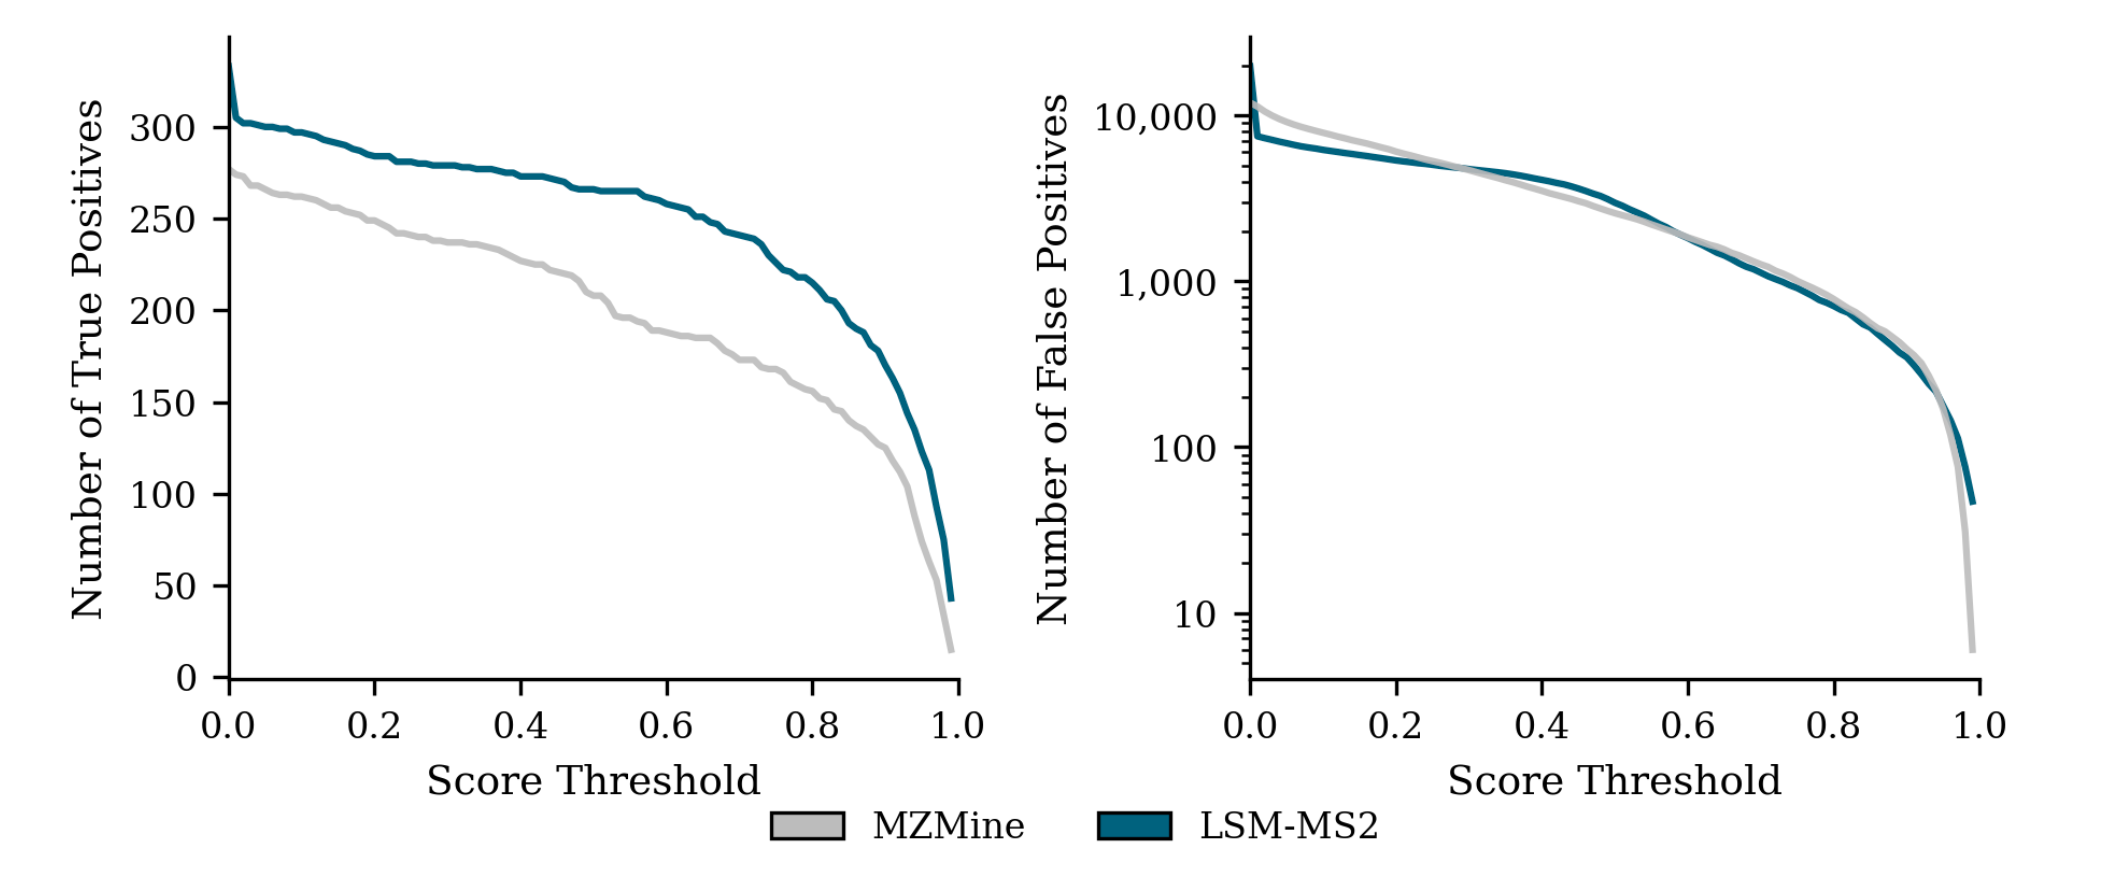
NIST Dilution Series
A NIST SRM 1950 human plasma dilution series used to evaluate performance in a biologically complex medium
Used to evaluate performance in a biologically complex medium, encompassing a wide dynamic concentration range and realistic signal-to-noise conditions.
LSM-MS2 consistently outperforms MZmine at optimal score thresholds, retrieving 42.4% more true positive identifications and achieving 33.3% higher precision with no corresponding increase in false positives.
In Action: Biological Interpretation Use Cases
Antipsychotic Overdose Classification
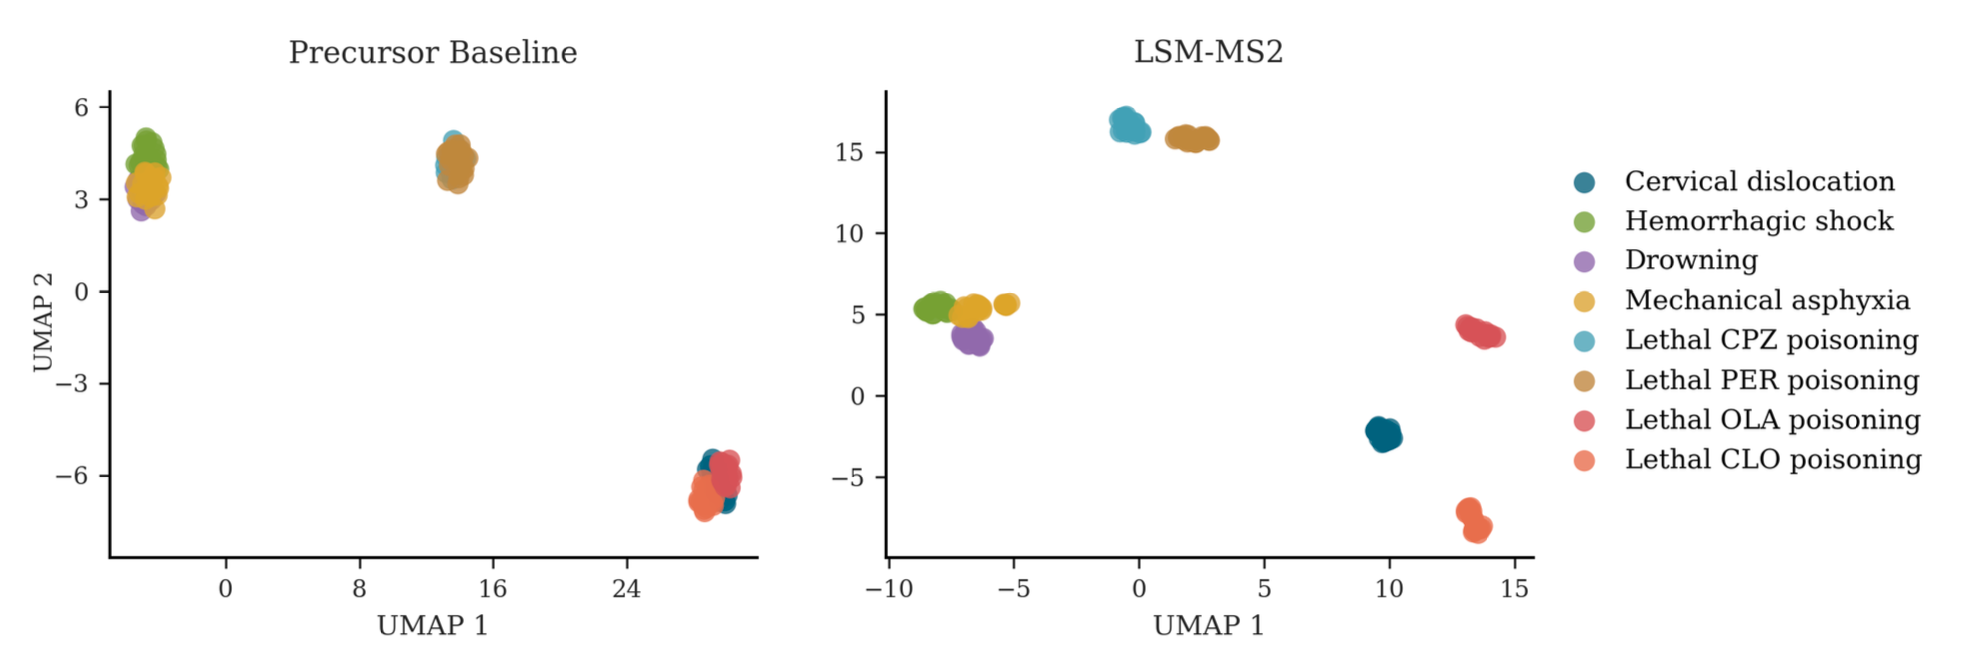
Fatal intoxication by antipsychotic agents remains a major challenge in forensic toxicology today. Using a dataset of 80 mouse plasma samples, Bai et al. performed LC–MS–based metabolomic profiling to investigate causes of death.
The dataset comprised eight groups: four drug-induced fatalities and four non–drug-related controls. The original study achieved clear separation between (1) overdose and control groups and (2) fatalities from chlorpromazine versus olanzapine.
To assess whether spectral representations can recover this missing structure, we construct a simple precursor baseline embedding for comparison with LSM-MS2. As shown below, this baseline reproduces the same lack of separation reported by Bai et al.
In contrast, clustering based on LSM-MS2 embeddings yields markedly improved resolution across all drug groups. Notably, samples corresponding to drowning, asphyxia, and hemorrhagic shock—conditions sharing hypoxic mechanisms—cluster closely together. These findings suggest that LSM-MS2 captures a more structured and biologically informative representation of metabolic variation than heuristic baselines.
Cystic Fibrosis Biomarkers
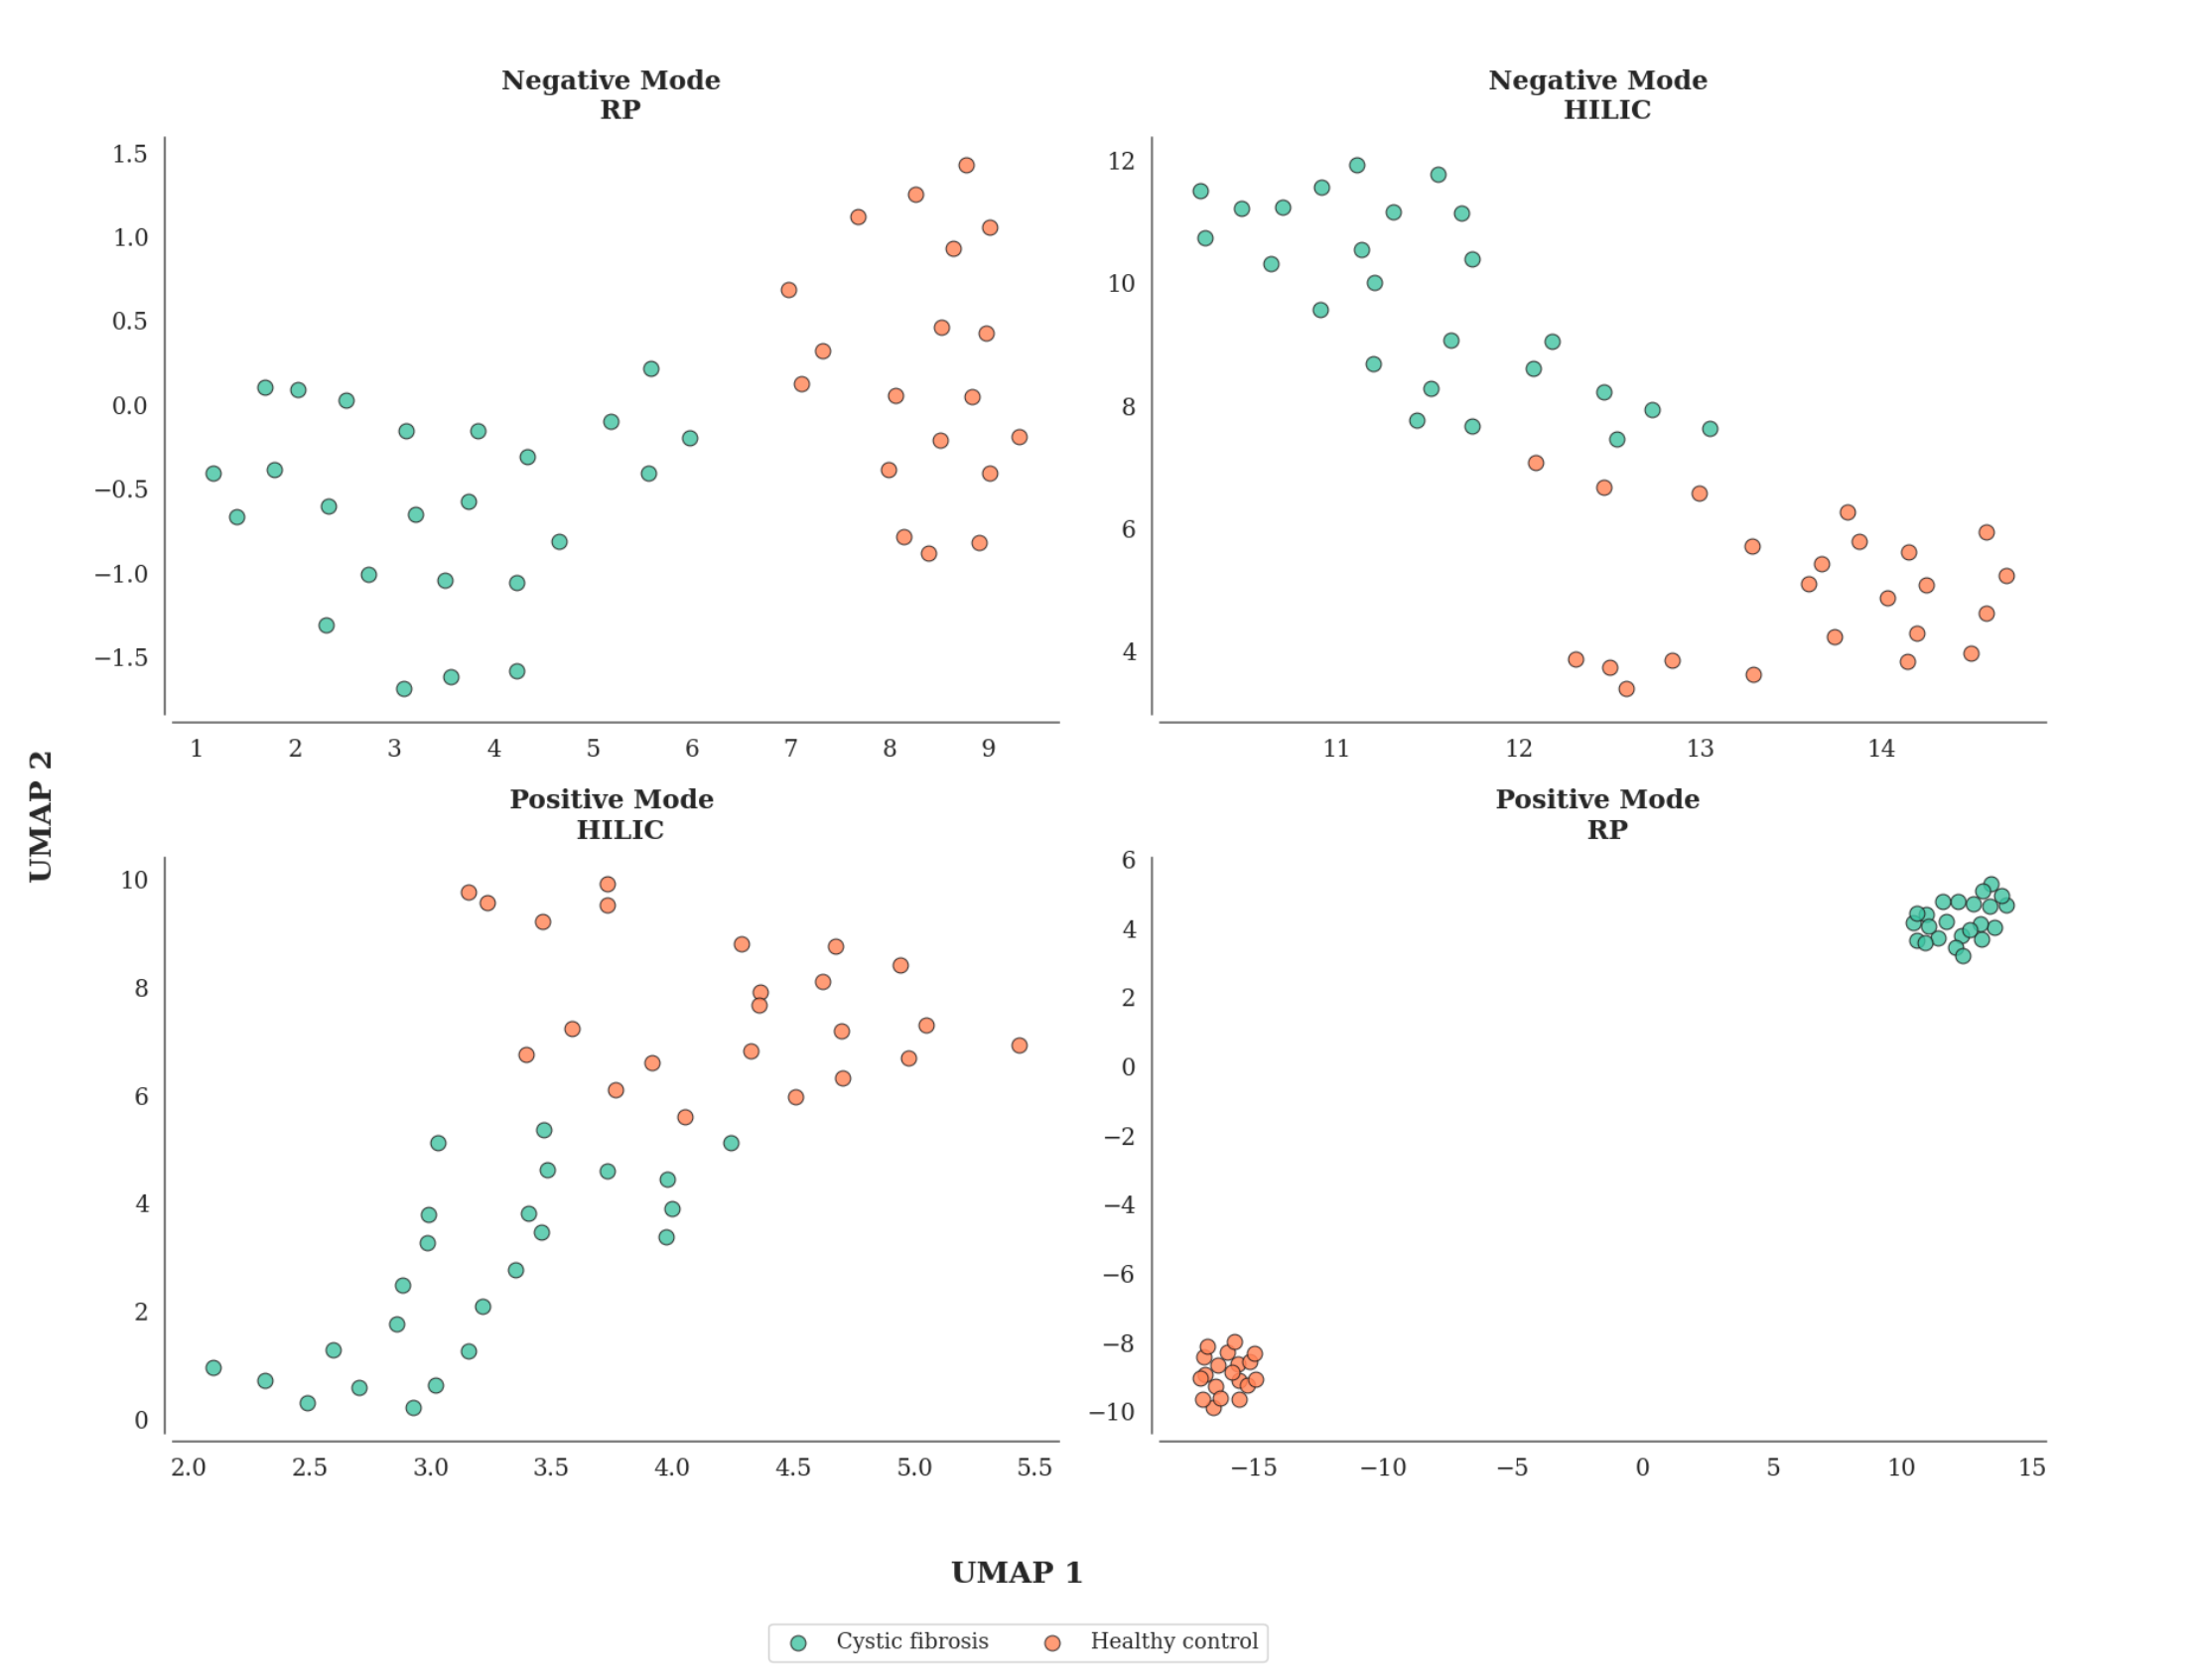
Identifying and quantifying metabolic biomarkers associated with cystic fibrosis provides valuable insights for early diagnosis, patient stratification, and disease progression mitigation.
The cohort comprised 50 participants, including 24 untreated cystic fibrosis patients and 26 age- and sex-matched healthy controls. Plasma samples were analyzed using both reversed-phase and HILIC mass spectrometry in positive and negative ionization modes.
Each analytical platform revealed distinct and complementary biochemical profiles, reflecting the multifaceted metabolic alterations characteristic of cystic fibrosis.
Similarly, we find unsupervised clustering of the LSM-MS2 sample representations revealed clear discrimination of the two cohorts, across all chromatographic methods and ionization modes. Notably, the reversed-phase method in positive ionization mode exhibited the most pronounced separation between groups, indicating stronger discrimination of metabolomic signatures under these analytical conditions.
How to use LSM-MS2
LSM-MS2 is available today in the Pyxis platform. Sign up for our early access program on our website to get started. Individual researchers can start with complimentary analysis credits at no cost.
Frequently Asked Questions
-
Pyxis processes standard mass spectrometry formats including mzML, mzXML, wiff, and Thermo RAW files.
-
No. Pyxis is designed for bench scientists and analytical chemists. Upload your MS2 data and get results. No coding or command-line tools required.
-
Pyxis combines three capabilities in one platform: state-of-the-art identification algorithms based on Large Spectral Models, a comprehensive built-in reference library, and complete cloud-based analysis workflow. Many existing solutions excel at one aspect but require you to assemble the other pieces yourself. Pyxis gives you everything integrated—from raw data upload to biological insights.
-
Individual researchers can start with complimentary analysis credits at no cost. For ongoing use, contact our team to discuss options. Enterprise customers should reach out to sales@matterworks.ai for volume pricing and custom deployments.
-
Yes. Every identification includes a score, and you can inspect the spectral match quality through interactive mirror plots comparing your query spectrum against the reference. All fragment ion matches are transparent and verifiable.
-
Pyxis has been validated across major LC-MS/MS platforms including Thermo Fisher, Waters, Agilent, and SCIEX systems. The platform adapts to different collision energies, fragmentation methods, and mass accuracy specifications.
-
This public release provides relative abundance quantification. Our absolute quantification capabilities are available to enterprise customers: contact sales@matterworks.ai for more information.
-
Yes. Pyxis has been validated on plant metabolomics, microbial metabolomics, environmental samples, and various model organisms. The underlying spectral models learn chemistry patterns that transfer across sample types.
-
Typical untargeted metabolomics studies (50-100 samples) complete in ~20 minutes from upload to results.
-
Yes. All analysis results, data tables, and visualizations can be downloaded. Exports include metabolite identifications with scores, statistical analysis results, and publication-ready figures in standard formats.
Ready to get started?
Sign up for early access and start analyzing your MS2 data today.